August 14 temporary update: with the recent reference via Forbes, it is just worth a note that we have a free data repository that you may find interesting.
From Berkshire Hathaway's recent 2013 Annual Report:
"Charlie Munger, Berkshire’s vice chairman and my partner, and I believe both Berkshire’s book value and intrinsic value will outperform the S&P in years when the market is down or moderately up. We expect to fall short, though, in years when the market is strong – as we did in 2013. We have underperformed in ten of our 49 years, with all but one of our shortfalls occurring when the S&P gain exceeded 15%."
On one hand, Warren Buffett has had an extrordinary career performance of 49 years. On the other hand, his probabilistic comments concerning performance differences lately, leaves some gaps. Is a S&P gain exceeding 15% (>15%) considered "strongly up"? If Buffett underperformed nearly 1/5 of the time, then we might think a "strongly up" market is a threshold only achieved in about 10 of the past 49 years. But in fact, his reported benchmark's S&P rose >15% is far more commonplace, occurring in 24 of the past 49 years (nearly half the years). So the quote above has the same absurd utility as a politician stating he or she doesn't always lie, but when he or she does it mostly just happens in the even numbered years (e.g., 2008, 2010, 2012, etc.) And then you have to fret over which year that politician made the statement...

One may also like this link concerning low single-digit market forecasts. Now see the descriptive chart above for the annual frequency count of S&P performance, and the frequency count for Buffett's underperforming years. Now some can be thinking, among other things, that underperformance in those 24 years was only 9 times (so just 38% of the time).
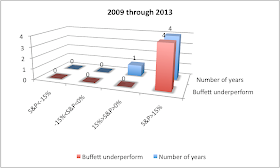
The issue with this line of thinking is that it implies there is homogeneity in this underperformance relative to the S&P's >15% annual performance. Here too, the underlying statistics fall apart. Let's decompose this chart above and isolate Buffett's performance during the past 5 years. We see in the chart below that 4 of the 9 years that Buffett has underperformed, during "strongly up" years, were in just the past 5 years. And there were 4 "strongly up" years in the past 5, so Buffett didn't underperform 38% of the time then, but 100% of this time (4 of 4).
More broadly, nearly half of this "strongly up" deterioration, in Buffett's 49 year investment history, has happened in just the past 5 years (4 of 9). See the green triangle data, in the lower-left of the chart here where we look at value changes, instead of the counts analysis here. Certainly that should have been part of the quote above.
And, could this performance have something to do with the strong run in the S&P during the past five years? Once again this is false. We also show below the segmentation of the topmost chart, with two other five-year timeframes. In the charts below we see in 1995 through 1999, only 1 of 5 "strongly up" years did Buffett underperform (so down to 20%, from 100%). And further back in time, from 1984 through 1988, none of 3 "strongly up" years did Buffett underperform (so now down to 0% of these times).


So if we see anything, from the time frame decomposition, it is that Buffett's underpeformance has simply taken some lumps along with everyone else with such a lengthy investment career. His overall performance is exceptional, but the explanatory quote above in the annual report is poor. An analyst should interpret the biased quote as misleading statistics (since the causality is wrong), just as one would consider the idea of a manager thinking their information ratio should exclude periods if and once the benchmark deviates by a lot.
Beyond this, if statistical mean-reversion has anything to say about market patterns, then Buffett should experience continued stressed performance at the same good rate (of course 10 of 49 of underperformance is slightly higher than the 14% rate we're used to from Buffett prior to 5-years ago, though it's still very good overall) in the future. These count patterns would come under pressure even if the annual up-streaks in the market dissolve back to a more normal, efficient market pattern.
Also from the Berkshire Hathaway's report:
"If you instead focus on the prospective price change of a contemplated purchase, you are speculating. There is nothing improper about that. I know, however, that I am unable to speculate successfully, and I am skeptical of those who claim sustained success at doing so. Half of all coin-flippers will win their first toss; none of those winners has an expectation of profit if he continues to play the game."
This is problematic as Buffett's comments reduce trading speculators (though sheltering active investors from this characterization) to 50/50 flippers of fair coins. And even still, there are abstruse, gambling strategies to convert various random walk (e.g., a jagged pattern of walking in either direction, similar to the sequence of outcomes from coin flips) into profitable trading strategies. See this publication (here, and here), which is in two leading academic research databases (one in science, and one in economics).
Additional notes:
In terms of these coin tossing probabilities, we can give Buffett the benefit of the doubt and suggest his overall, well-skilled performance is continuously similar to that from an unfair coin that lands on heads 80% of the time (reflecting the ratio of Buffett's 39 out of 49 years of outperformance). The probability of such an unfair coin landing on heads at least 39 times out of 49 flips is 61%. This is simply the combination of choosing n=39 from 49 (or 49C39), multiplied by 80%n, multiplied by (100%-80%)49-n. Then we sum this for n=39, to 49. For more on combinatorial probabilities, one can optionally see these notes (here, and here)
So now the chance of seeing the 5-year "abberative" streak, of at least 4 losses in 5 years (either at the start or the conclusion of a 49-year pattern) would come to roughly 3% (or instead about 5% if we want to just isolate the loss counts instead to 3 of the past 4, or 5 of the past 6). This is important to often apply and can be carefully solved at least two general ways, using both a combinatorial mathematics estimate and another with a difference in means estimate (or a t-distribution test). The bottom line is that we can best explain the pattern with an unfair coin analogy, and even then it is rare to see such a dichotomous drop-off at one end to be simply a normal (non-significant) continuation of the other 44-trials period. We still get rare, but less certain results, if we practically rethink the coin toss analogy to a smaller number of serial-correlated results.
There are also multiple other ways to consider this problem, and some are not so meaningful here. What would also lose statistical credibility, for example, is if one were to go above and beyond these paragraphs, and suggesting there is one pattern completely flanked by a different pattern. Or even apply a weaker test that incorporates full serial-correlation, on the two time partitions.
From Berkshire Hathaway's recent 2013 Annual Report:
"Charlie Munger, Berkshire’s vice chairman and my partner, and I believe both Berkshire’s book value and intrinsic value will outperform the S&P in years when the market is down or moderately up. We expect to fall short, though, in years when the market is strong – as we did in 2013. We have underperformed in ten of our 49 years, with all but one of our shortfalls occurring when the S&P gain exceeded 15%."
On one hand, Warren Buffett has had an extrordinary career performance of 49 years. On the other hand, his probabilistic comments concerning performance differences lately, leaves some gaps. Is a S&P gain exceeding 15% (>15%) considered "strongly up"? If Buffett underperformed nearly 1/5 of the time, then we might think a "strongly up" market is a threshold only achieved in about 10 of the past 49 years. But in fact, his reported benchmark's S&P rose >15% is far more commonplace, occurring in 24 of the past 49 years (nearly half the years). So the quote above has the same absurd utility as a politician stating he or she doesn't always lie, but when he or she does it mostly just happens in the even numbered years (e.g., 2008, 2010, 2012, etc.) And then you have to fret over which year that politician made the statement...

The issue with this line of thinking is that it implies there is homogeneity in this underperformance relative to the S&P's >15% annual performance. Here too, the underlying statistics fall apart. Let's decompose this chart above and isolate Buffett's performance during the past 5 years. We see in the chart below that 4 of the 9 years that Buffett has underperformed, during "strongly up" years, were in just the past 5 years. And there were 4 "strongly up" years in the past 5, so Buffett didn't underperform 38% of the time then, but 100% of this time (4 of 4).

More broadly, nearly half of this "strongly up" deterioration, in Buffett's 49 year investment history, has happened in just the past 5 years (4 of 9). See the green triangle data, in the lower-left of the chart here where we look at value changes, instead of the counts analysis here. Certainly that should have been part of the quote above.
And, could this performance have something to do with the strong run in the S&P during the past five years? Once again this is false. We also show below the segmentation of the topmost chart, with two other five-year timeframes. In the charts below we see in 1995 through 1999, only 1 of 5 "strongly up" years did Buffett underperform (so down to 20%, from 100%). And further back in time, from 1984 through 1988, none of 3 "strongly up" years did Buffett underperform (so now down to 0% of these times).


So if we see anything, from the time frame decomposition, it is that Buffett's underpeformance has simply taken some lumps along with everyone else with such a lengthy investment career. His overall performance is exceptional, but the explanatory quote above in the annual report is poor. An analyst should interpret the biased quote as misleading statistics (since the causality is wrong), just as one would consider the idea of a manager thinking their information ratio should exclude periods if and once the benchmark deviates by a lot.
Beyond this, if statistical mean-reversion has anything to say about market patterns, then Buffett should experience continued stressed performance at the same good rate (of course 10 of 49 of underperformance is slightly higher than the 14% rate we're used to from Buffett prior to 5-years ago, though it's still very good overall) in the future. These count patterns would come under pressure even if the annual up-streaks in the market dissolve back to a more normal, efficient market pattern.
Also from the Berkshire Hathaway's report:
"If you instead focus on the prospective price change of a contemplated purchase, you are speculating. There is nothing improper about that. I know, however, that I am unable to speculate successfully, and I am skeptical of those who claim sustained success at doing so. Half of all coin-flippers will win their first toss; none of those winners has an expectation of profit if he continues to play the game."
This is problematic as Buffett's comments reduce trading speculators (though sheltering active investors from this characterization) to 50/50 flippers of fair coins. And even still, there are abstruse, gambling strategies to convert various random walk (e.g., a jagged pattern of walking in either direction, similar to the sequence of outcomes from coin flips) into profitable trading strategies. See this publication (here, and here), which is in two leading academic research databases (one in science, and one in economics).
Additional notes:
In terms of these coin tossing probabilities, we can give Buffett the benefit of the doubt and suggest his overall, well-skilled performance is continuously similar to that from an unfair coin that lands on heads 80% of the time (reflecting the ratio of Buffett's 39 out of 49 years of outperformance). The probability of such an unfair coin landing on heads at least 39 times out of 49 flips is 61%. This is simply the combination of choosing n=39 from 49 (or 49C39), multiplied by 80%n, multiplied by (100%-80%)49-n. Then we sum this for n=39, to 49. For more on combinatorial probabilities, one can optionally see these notes (here, and here)
So now the chance of seeing the 5-year "abberative" streak, of at least 4 losses in 5 years (either at the start or the conclusion of a 49-year pattern) would come to roughly 3% (or instead about 5% if we want to just isolate the loss counts instead to 3 of the past 4, or 5 of the past 6). This is important to often apply and can be carefully solved at least two general ways, using both a combinatorial mathematics estimate and another with a difference in means estimate (or a t-distribution test). The bottom line is that we can best explain the pattern with an unfair coin analogy, and even then it is rare to see such a dichotomous drop-off at one end to be simply a normal (non-significant) continuation of the other 44-trials period. We still get rare, but less certain results, if we practically rethink the coin toss analogy to a smaller number of serial-correlated results.
There are also multiple other ways to consider this problem, and some are not so meaningful here. What would also lose statistical credibility, for example, is if one were to go above and beyond these paragraphs, and suggesting there is one pattern completely flanked by a different pattern. Or even apply a weaker test that incorporates full serial-correlation, on the two time partitions.
Can you tell me if early stock picks by Mr Buffett account for his long track record ?
ReplyDeletethat is, if you invest in only a small number of stocks, if you happened to pick MS and a few other like that in year one, you could probably pick total dogs for the remainder of your career, and still look good.
same thing with m romney; per iirc the FT london, of ~ 150 deals, almost all the money was made on <5
Thanks much Soccer Dad. I didn't analyze the data (nor have the data) to solve the question you asked. However, if you read this article here (titled "The forever elusive α"), it provides additional clarity on how it is more likely that the initial 44 years were all collectively important (but doesn't look through the prism instead of specific initial investment choices): http://statisticalideas.blogspot.com/2014/02/forever-elusive-alpha.html
DeleteYour analysis got picked up in a New York Times article today. I like the fact that you use good statistical analysis to explore what is true and what is probable, without trying to guess what is unknown. The NYT article had a telling quote from Mr Buffet in which he details his instructions for his wife's trust: Invest 90% in an S&P 500 index fund and keep the rest in short term government debt! He must believe your analysis more than his own.
ReplyDeleteThanks much Steve. It looks like many people enjoyed the article, so that's great. Hope that you enjoy other contributions on this web log!
DeleteDear Salil, thank you very much for the analysis provided here. It sure helps inform the discussion of actively managed funds versus index funds. And, while perhaps angled towards such rhetoric, your analysis was very even keeled and added just fact-based interpretation (leaving aside unfounded speculations) so that others could make meaning of it in its most virgin-state form.
ReplyDeleteOn the article by the NY Times (the NY Times took your precious analysis and bastardized it):
As long as people's Amygdalas can be stimulated with silly extrapolations, like NY Times often does (i.e. "Buffett has lost his mojo", paraphrased), our citizens will continue making mistakes like fundamental attribution errors (thinking that it is the person - Buffett-, not the situation, versus asking what in the situation has changed: Example is High Frequency Trading, which jumps in front of the queue of traditional investors like Buffett by using, admittedly, privileged information).
If Buffet changes its game plan this late in life, it can be too risky. However, his successor has many options to consider in transforming Berkshire Hathaway into the future (perhaps invest pseudo-passively by considering the effect of HFT in average acquisition prices, perhaps negotiating deals more privately like Private Equities do or creating a Washington lobby to weaken the HFT paradigm... perhaps a little of all 3 strategies at once).
My two cents ...
Angelo
Thanks much Angelo. Glad you enjoyed the article. For a while today it seemed as if many professionals and students were able to read the New York Times article and share in the discussion, among their friends.
DeleteThere is much low frequency noise in the markets. A random guess (for example, that packaged goods companies will do better than the market, or worse) will far over (or under) perform the market for many years. If you are right in a few of these guesses, your long term record will be spectacular. This may be what happened with Buffet.
ReplyDeleteThe question is how likely this is. If performance in each year were an independent random event, the chance of being above average in 35 out of 40 years would be infinitesimal (and easily calculated). But if only a half-dozen truly independent decisions are made in a career, the chance of being right in five of the six is not so small. With a population of hundreds of professional investors, someone will likely do that well. Buffet didn't have inside information, and his principles are taken from the standard textbook, available and known to everyone. Perhaps he was just lucky, but not astonishingly so.
Thanks much Jonathan. So there are issues with going down the track you mention, which are processing details on expected covariances, corporate-actions, and benchmark constituent changes, all of which would vary for different horizons and impact securities' alpha (α) over that lengthier time, in-between investment choices. Plus with the number of coin-flipping trials, the error is inversely proportional to a function of the number of flipping trials (more flips if using 1 year increments, and less if using 5 year increments). Right now the 3% chance, of Buffett's recent 5 years performance being dichotomously different, would still be in the less than the 5% range if we consider the flexibility of when and how one chooses to start and terminate the streak. Still, "The forever elusive α" article here does "partially" use this as a basic framework in order to provide a greater outperformance probability weight enhanced from this concept of serial-correlation. http://statisticalideas.blogspot.com/2014/02/forever-elusive-alpha.html
DeleteStill, back to the coin flipping example from BRK's annual report, it is a more convoluted probability exercise to work with these extended intervals (particularly if one is solving for outcomes that are something other than requiring all coin flips having to land on tails or signify success). Extending the time horizon in-between investment, for one person, to 5 years (from 1 year) would reduce both the expected annual outperformance by a lot (since no one stock likely remains greatly outperforming every year), and the typical dispersion of outcomes by a smaller amount.
So to better convert to the probability associated with this more auto-correlated individual, we get about 55%^11. The 55% takes into account for the expected performance drop because of extending the timeframe in-between decisions. And we need about 11 economic decisions (one per economic cycle) to cover an active investing lifetime, instead of the 5 you note. This probability, or even a more conservative 60%^10, reduces to less than 1% chance!
How do we know the original weight of the coin was just wrong? i.e. maybe Buffett deserved to be a 60% weighted coin all along. The recent performance isn't so much a drop in skill as the prior performance was especially lucky. So the recent underperformance is more a reflection of his strategy not being as effective as once thought, rather than him getting "worse". Given that we haven't really observed a change in his investment method, isn't that the more likely interpretation?
ReplyDeleteThanks much Anonymous. The most likely outperformance looks at a wide range of possibilities for the entire 49-year record, and both the first (43 or) 44-years and past (6 or) 5-years. There is considerable probability material on this, including this "Market's downward tilt" research article. http://statisticalideas.blogspot.com/2014/01/markets-downward-tilt.html
DeletePosted this on your about page, as well but didn't get an answer. And I couldn't figure out how to get in touch with you directly. What are you basing the fact that Buffett underperformed or outperformed the S&P 500? Book value or Buffett's adjusted book value? I know that Buffett uses that, but the comparison seems odd these days. As Berkshire has become more of an operating company, Berkshire's book value is more comprised of corporate assets than financial assets. And corporate assets are subject to cost basis accounting rules that really don't have a lot to do with the underlying performance or value of those assets. Couldn't that be what's going on? And why there seems to be a sudden change in Buffett's performance? That change seems to match around the time the company bought Burlington Northern, an asset intensive business with a lot of depreciation. Thanks.
ReplyDeleteThanks much Stephen. My primary emphasis is on teaching probability and statistics, and only looks at specific, probability-related comments that were highly visible in the report to explain large investment ideas (e.g., rationale for when BRK underperforms, and coin flips). This is a very useful set of skills people can use to think about a number of types of decisions they need to make in life or among choices afforded to them. Other people can have an opinion on whether for BRK specifically they would like to now use a different standard or hypothesis despite what statistical performance data and some statistics commentary continues to appear in the annual report. And going down that road, along with other explanatory ideas radiating out from the financial press, only muddles the general conversation about how one should think about their own performance chances.
DeleteBuffett has outperformed by a wide margin over his entire career, whether or not you inject a different personal hypothesis for Buffett's recent (4 or) 5 years. I am pleasantly in agreement with everyone else on that. It still doesn't change that for most people, the idea of having an investment vehicle outperform (let alone with skill) a specified ex-ante, market benchmark over the long-haul is still a challenge.
I think that Stephen Gandel is asking what metric you used to measure Buffett's performance. It is not clear from the article.
DeleteYou make the comment that "having an investment vehicle outperform...over the long-haul is still a challenge." I certainly agree with that. But doesn't your analysis of Buffett's performance focus on year-by-year results and not the "long-haul?" Isn't what counts not the annual performance but the long term performance? And then the question is, what is the definition of "long-haul?" And shouldn't the performance be measured on a risk-adjusted basis?
DeleteThanks much Ed Lane. Probability theory can help explain these problems either by using higher-order mathematics (e.g., characteristic functions, or stochastic calculus), or by theoretically modeling with many discrete samples. And we use a blend of both throughout this web log. A careful reading of both studies here (so including the original "The forever elusive α" that shows normal risk-adjusted performance) show that there is an important reason why we also took a close look at the period since the financial crisis. We get a sense of how the probability models for broad outperformance in returns, and in the annual outperformance counts, provide new information that current investors should consider.
DeleteThere is of course a difference between a current 70 year old who has held on to BRK since he or she was 25 years old (such lengthy period is the long-haul), and a current 25 year old contemplating a first-time investment in same. For more advanced topics on incorporating new information, please see these two articles.
Count as an average:
http://statisticalideas.blogspot.com/2013/08/credibility-of-labor-market.html
Probability as an average:
http://statisticalideas.blogspot.com/2014/01/markets-downward-tilt.html
Thanks much Al. The blue line in "The forever elusive α" article, which must be read, measures appropriate risk-adjusted returns and is designed for an audience broader than Buffett followers. The green triangles are BRK's reported book value differences against the S&P 500, for two different investment horizons. This is the same measure Buffett uses, and among many other issues noted, obfuscates from evaluating BRK on a risk-adjusted basis.
Deletehttp://statisticalideas.blogspot.com/2014/02/forever-elusive-alpha.html
Also for the past 4-6 years this doesn't matter anyway, since the market differences doesn't come anywhere close to outperforming the market by a statistically large amount. While it's not part of the web log, it would be fair to state that this recent weakness isn't going to helpfully create a statistically large enough α (alpha) by now handicapping BRK with a minor risk adjustment.
Finally, if one were interested in just having some raw BRK data, then please see this link for the Statistical Ideas web portal.
https://sites.google.com/site/statisticalideas/home/brk-raw
As my name suggests, I am a firm believer in the EMT and don't see Buffett as its refutation. It's axiomatic that some people have to be on the good side of the bell curve. I think he's obviously brilliant, but I don't consider him a pure investor nor do I discount the massive effect that -- for want of a better word -- luck has magnified his success.
ReplyDeleteHowever, I don't know why you're placing such emphasis on trading delineated by years (or any time frame, for that matter). It's not a sporting competition: it doesn't matter who is on top at the end of the year and then everything resets back to zero. Buffett would be the first to tell you that it's not about what happens between Jan 1 and December 31 that matters, but what happens over many of those cycles. There is nothing special about a year, other than we're used to living in them.
Thanks much EMTist. Ultimately we need some sort of constant yardstick to measure everyone, against his or her respective benchmark. We don't know how long we'll work. How long we'll be retired for. Or when our spouse might survive in relation to that. So a few major uncertainties. Yet we know that across these times there will be an opportunity cost to taking broad asset-class risk, and an extra risk (maybe in exchange for a sizeable reward) associated with individual stock selection. Probability tools need some concept of time to consider this. In "The forever elusive α" article we simply look at accumulated risk-adjusted performance in annual cycles and how they contrast with that for simply a lucky performer. This is for all investors, in addition to BRK just for overall context. Please read it. This complementing note “Being good, until one's not” carries some corresponding insights by examining descriptive, frequency count statistics, which are displayed in Warren's annual report. http://statisticalideas.blogspot.com/2014/02/forever-elusive-alpha.html
Deletesir i read ur article published in the new york times
ReplyDeleteThanks much Arshad. Glad to hear that you enjoyed the two research articles in here.
DeleteAccording to the 2013 Annual Report, Berkshire's book value is up 73% since 2007 while the S&P 500 is up 44%. The massive out-performance in a down market is a critical factor in the strategy. Am not sure if this article fits into lies, damned lies or statistics.
ReplyDeleteThanks much Anonymous. Unfortunately you have not presented a well-reasoned comment. There is no statistically large outperformance (as opposed to which we are accustomed to pre-crisis, for BRK) whether one uses the past 4, 5, or 6 years. Whether one uses book value, or market value. And correlation over this time is highly muted as well.
DeleteSalil,
ReplyDeleteSo overall an interesting read but did you consider risk adjusted returns for calculating alpha?
I will really appreciate it if you can make your methodology and calculations public so that people can figure out things for themselves.
Thanks much Anonymous. Please see "The forever elusive α" article: http://statisticalideas.blogspot.com/2014/02/forever-elusive-alpha.html
DeleteAlso if BRK outperforms in 2014, this does not negate any research here. From a probability perspective, the expectation is that BRK outperform perhaps 2-4 times per next 5 years (or underperform 1-3 times). But still down from his pre-crisis rate of outperforming 4-5 times per 5 years (or underperform just 0-1 times) that BRK would normally see pre-crisis, and some in finance just assume must play out (without a clear rationale for why it should be on the high end of that outperformance range).
Beyond BRK, and returning to probability and variances, one may also like the "Bernoulli dispersions" article for a primer on the scale of proportion confidence intervals: http://statisticalideas.blogspot.com/2014/02/bernoulli-dispersions.html
Just a quick note (to all but the one insane staff at Fortune) that we had a great write-up in Sunday's New York Times print. A sequel to the popular analysis here.
ReplyDeletehttp://www.nytimes.com/2015/03/08/your-money/warren-buffetts-awesome-feat-at-berkshire-hathaway-revisited.html
With the focus changed from book value, to market value, the probability now of Buffett outperforming the overall "benchmark" will only be enhanced slightly. From the otherwise dismal odds I gave him here. Feel free to share and enjoy this raw BRK data. Thanks much!
https://sites.google.com/site/statisticalideas/home/brk-raw